Market Outlook
October 26, 2016
Market Cues
Domestic Indices
Chg (%)
(Pts)
(Close)
Indian markets are likely to negative tracking global cues and SGX Nifty.
BSE Sensex
(0.3)
(88)
28,091
Nifty
(0.2)
(18)
8,691
U.S. indices dropped on Tuesday reversing most of the previous day’s gains. This
was a reaction to the Consumer Confidence index coming in much lower than
Mid Cap
(0.3)
(41)
13,544
expected. This indicates a softening of consumer assessment of current business and
Small Cap
0.1
17
13,519
employment conditions. Procter & Gamble (PG) gave a strong move of 3.4% after
Bankex
0.3
57
22,779
the company reported quarterly results that exceeded analyst expectations.
UK’s FTSE index rallied on Tuesday as rising metal prices provided a boost to mining
Global Indices
Chg (%)
(Pts)
(Close)
companies. Mining and commodities trading firm Glencore climbed 3.60% after
Dow Jones
(0.3)
(54)
18,169
signing a deal for high-quality thermal coal. Anglo American rose sharply by 4.5%
after the company left its output guidance broadly unchanged for most of its
Nasdaq
(0.5)
(26)
5,283
commodities.
FTSE
0.4
31
7,018
Indian indices lost ground on Tuesday, as all Tata group stocks posted losses after
Nikkei
0.8
131
17,365
the announcement of the replacement of Cyrus Mistry. Banking stocks performed
Hang Seng
(0.2)
(39)
23,565
poorly with HDFC and Kotak Mahindra Bank dropping 1.3% and 0.5% respectively.
Shanghai Com
0.1
4
3,132
Idea Cellular fell over 2% after it reported an 59% decline QoQ in profits for
Q2FY17.
Advances / Declines
BSE
NSE
Advances
1,322
679
Result Review
Declines
1,488
952
Result Review: Dr. Reddys, Alembic Pharma
Detailed analysis on Pg2
Unchanged
235
73
Investor’s Ready Reckoner
Volumes (` Cr)
Key Domestic & Global Indicators
BSE
2,988
Stock Watch: Latest investment recommendations on 150+ stocks
NSE
20,503
Refer Pg6 onwards
Top Picks
Net Inflows (` Cr)
Net
Mtd
Ytd
CMP
Target
Upside
Company
Sector
Rating
FII
(392)
(996)
49,009
(`)
(`)
(%)
Amara Raja Batteries Auto & Auto Ancill.
Buy
1,033
1,218
17.9
MFs
527
5,287
19,234
HCL Tech
IT
Buy
804
1,000
24.4
Bharat Electronics
Capital Goods
Accumulate
1,265
1,414
11.8
Top Gainers
Price (`)
Chg (%)
Equitas Holdings
Financials
Buy
178
235
32.1
Arvind
404
12.3
Navkar Corporation Others
Buy
200
265
32.5
Adaniports
313
9.4
More Top Picks on Pg5
Federalbnk
81
8.3
Key Upcoming Events
Manappuram
105
6.3
Previous
Consensus
Date
Region
Event Description
Reading
Expectations
Mmtc
48
6.1
Oct 26 US
New home sales
609.0
600.0
Oct 27 UK
GDP (YoY)
2.1
2.1
Top Losers
Price (`)
Chg (%)
Oct 27 US
Initial Jobless claims
260.0
--
Gsfc
92
(6.6)
Oct 28 Euro Zone
Euro Zone Consumer Confidence
(8.0)
(8.0)
Adanient
68
(5.3)
Oct 28 UK
PMI Manufacturing
55.4
--
Adanipower
26
(4.3)
Oct 31 US
GDP QoQ (Annualised)
1.4
2.5
Nov 01 Euro Zone
Euro Zone GDP s.a. (QoQ)
0.3
--
Kajariacer
598
(3.4)
Nov 01 China
PMI Manufacturing
50.4
50.4
Balramchin
117
(3.3)
6.(
More Events on Pg6
As on October 25, 2016
Market Outlook
October 26, 2016
Result Review
Dr Reddy’s Labs (CMP: `3,200 / TP: /Upside:)
Dr Reddy’s Lab posted results lower than expected on net profit front, while the
sales were marginally higher than expected and operating profits, much lower
than expected. In rupee terms, the consolidated revenues; came in at `3,586cr V/s
`3,500cr expected, down 10.1% yoy, mainly driven by pressure on the generic
market. The global generic market with sales (`2,899.5cr, down 12.0% yoy),
mainly lead by the Europe(`177.6cr,
16% dip yoy) and Emerging market
(`483.4cr, a yoy dip of 27%). The PSAI segment (posted sales of `578.4cr, down
by 2.0%). On operating front, the EBIT margins came in at 8.7% V/s 12.1%
expected V/s 22.4% in 2QFY2016.Consequently, PAT came in at `295cr V/s
`325cr expected V/s `722cr in 2QFY2016, yoy de-growth of 58.0%. We maintain
our neutral rating on the stock.
Y/E
Sales OPM
PAT
EPS ROE P/E P/BV EV/EBITDA EV/Sales
March
(` cr)
(%)
(` cr)
(`)
(%)
(x)
(x)
(x)
(x)
FY2017E
16,043
23.1
2,150
126.0
15.7
24.7
3.6
14.1
3.3
FY2018E
18,119
24.7
2,6925
157.8
17.1
19.7
3.1
11.6
2.9
Alembic Pharma (CMP: `678 / TP: /Upside:)
Alembic Pharma, posted sales of `750cr V/s `1,008cr down by 25.6% yoy, mainly
on back of base effect. International business is expected to decline owing to lower
contribution from gAbilify. On operating front, the gross margins are expected to
come in at 73.4% V/s 77.5% in 2QFY2016, with EBIDTA margins coming in at
21.9% V/s 37.2% in 2QFY2016. Consequently, PAT is expected to come in at
`112r V/s `290cr, a yoy dip of 61.2%. We maintain our neutral rating on the
stock.
Y/E
Sales OPM
PAT
EPS ROE P/E P/BV EV/EBITDA EV/Sales
March
(` cr)
(%)
(` cr)
(`)
(%)
(x)
(x)
(x)
(x)
FY2017E
3,483
20.2
459
55.7
24.3
27.9
6.4
17.8
3.6
FY2018E
4,083
21.4
572
64.1
30.4
22.4
5.1
13.9
3.0
Quarterly Bloomberg Brokers Consensus Estimate
Canara Bank Ltd - Oct 26, 2016
Particulars ( ` cr)
2QFY17E
2QFY16
y-o-y (%)
1QFY17 q-o-q (%)
PAT
96
529
(81.8)
229
(57.9)
Housing Development Finance Corp Ltd - Oct 26, 2016
Particulars ( ` cr)
2QFY17E
2QFY16
y-o-y (%)
1QFY17 q-o-q (%)
PAT
1,959
1,605
22.1
1,871
4.7
Market Outlook
October 26, 2016
ITC Ltd - Oct 26, 2016
Particulars ( ` cr)
2QFY17E
2QFY16
y-o-y (%)
1QFY17
q-o-q (%)
Net sales
9,355
8,805
6.3
13,157
(28.9)
EBITDA
3,702
3,560
4.0
3,526
5.0
EBITDA margin (%)
39.6
40.4
26.8
Net profit
2,503
2,431
3.0
2,385
5.0
HeroMotoCorp Ltd - Oct 26, 2016
Particulars ( ` cr)
2QFY17E
2QFY16
y-o-y (%)
1QFY17
q-o-q (%)
Net sales
7,646
6,745
13.4
7,290
4.9
EBITDA
1,205
1,083
11.2
1,230
(2.0)
EBITDA margin (%)
15.8
16.1
16.9
Net profit
843
772
9.2
883
(4.5)
Exide Industries Ltd - Oct 26, 2016
Particulars ( ` cr)
2QFY17E
2QFY16
y-o-y (%)
1QFY17
q-o-q (%)
Net sales
1,947
1,736
12.1
2,008
(3.0)
EBITDA
306
257
19.0
315
(2.7)
EBITDA margin (%)
15.7
14.8
15.7
Net profit
186
156
19.4
196
(4.9)
Dabur India Ltd Consol - Oct 26, 2016
Particulars ( ` cr)
2QFY17E
2QFY16
y-o-y (%)
1QFY17
q-o-q (%)
Net sales
2,275
2,092
8.8
1,924
18.3
EBITDA
368
404
(9.0)
349
5.5
EBITDA margin (%)
16.2
19.3
18.1
Net profit
300
341
(12.0)
293
2.5
Hindustan Unilever Ltd - Oct 26, 2016
Particulars ( ` cr)
2QFY17E
2QFY16
y-o-y (%)
1QFY17
q-o-q (%)
Net sales
8,498
7,820
8.7
7,988
6.4
EBITDA
1,658
1,326
25.0
1,636
1.3
EBITDA margin (%)
19.5
17.0
20.5
Net profit
1,157
962
20.2
1,245
(7.1)
Cummins India Ltd - Oct 26, 2016
Particulars ( ` cr)
2QFY17E
2QFY16
y-o-y (%)
1QFY17
q-o-q (%)
Net sales
1,307
1,167
12
1,228
6
EBITDA
203
201
1
206
-2
EBITDA margin (%)
16
17
17
Net profit
198
199
-0
181
9
Cadila Healthcare Ltd - Oct 26, 2016
Particulars ( ` cr)
2QFY17E
2QFY16
y-o-y (%)
1QFY17
q-o-q (%)
Net sales
2,460
2,459
2,287
7.6
EBITDA
558
621
10.1
524
6.5
EBITDA margin (%)
22.7
25.3
22.9
Net profit
376
391
(3.8)
356
(5.6)
Market Outlook
October 26, 2016
Economic and Political News
Telecom Minister warns that action will be taken against telecom firms that fail
to provide quality services to consumers
Airports Authority of India (AAI) launches air cargo and logistics subsidiary
Phase-III auction of radio channels estimated to bring $390 million in revenue
to the government
Corporate News
L&T Infotech announces acquisition of analytics start-up AugmentIQ Data
Sciences Ltd for an undisclosed amount
RIL raises $573mln loan for partial financing for construction of 6 ethane
carriers
SBI raises `2,500cr from sale of bonds
Market Outlook
October 26, 2016
Top Picks ★★★★★
Large Cap
Market Cap
CMP
Target
Upside
Company
Rationale
(` Cr)
(`)
(`)
(%)
To outpace battery industry growth due to better technological
Amara Raja Batteries
17,644
1,033
1,218
17.9
products leading to market share gains in both the
automotive OEM and replacement segments.
Healthy pace of branch expansion, backed by distribution
Axis Bank
1,26,271
529
630
19.1
network, will be the driving force for the bank’s retail business
and overall earnings.
Uptick in defense capex by government when coupled with
Bharat Electronics
30,348
1,265
1,414
11.8
BELs strong market positioning, indicate that good times are
ahead for BEL.
The stock is trading at attractive valuations and is factoring all
HCL Tech
1,13,446
804
1,000
24.4
the bad news.
Back on the growth trend, expect a long term growth of 14%
Infosys
2,33,680
1,017
1,249
22.7
to be a US$20bn in FY2020.
Source: Company, Angel Research
Mid Cap
Market Cap
CMP
Target
Upside
Company
Rationale
(` Cr)
(`)
(`)
(%)
We expect the company would report strong profitability
Asian Granito
830
276
351
27.3
owing to better product mix, higher B2C sales and
amalgamation synergy.
Among the top 4 players in the consumer durables segment.
Bajaj Electricals
2,636
261
306
17.4
Improved profitability backed by turn around in E&P segment.
Strong order book lends earnings visibility.
Favourable outlook for the AC industry to augur well for
Cooling products business which is out pacing the market
Blue Star
5,180
543
634
16.7
growth. EMPPAC division's profitability to improve once
operating environment turns around.
With a focus on the low and medium income (LMI) consumer
Dewan Housing Finance
9,508
326
350
7.4
segment, the company has increased its presence in tier-II &
III cities where the growth opportunity is immense.
Strong loan growth backed by diversified loan portfolio and
Equitas Holdings
5,966
178
235
32.1
adequate CAR. ROE & ROA likely to remain decent as risk of
dilution remains low. Attractive valuations considering growth.
Economic recovery to have favourable impact on advertising
& circulation revenue growth. Further, the acquisition of a
Jagran Prakashan
6,510
199
225
13.0
radio business (Radio City) would also boost the company's
revenue growth.
Speedier execution and speedier sales, strong revenue visibilty
Mahindra Lifespace
1,789
436
522
19.7
in short-to-long run, attractive valuations
We expect the company to report strong growth on back of
healthy growth in domestic branded sales (owing to
Mirza International
1,135
94
113
19.8
aggressive ad spend and addition in the number of EBOs &
multi-brand outlets [MBOs]) and healthy export revenues.
Massive capacity expansion along with rail advantage at ICD
Navkar Corporation
2,852
200
265
32.5
as well CFS augurs well for the company.
Strong brands and distribution network would boost growth
Siyaram Silk Mills
1,441
1,537
1,714
11.5
going ahead. Stock currently trades at an inexpensive
valuation.
Market leadership in Hindi news genre and no. 2 viewership
ranking in English news genre, exit from the radio business,
TV Today Network
1,998
335
363
8.4
and anticipated growth in ad spends by corporates to benefit
the stock.
Source: Company, Angel Research
Market Outlook
October 26, 2016
Key Upcoming Events
Result Calendar
Date
Company
Hero Motocorp, Exide Industries, Cummins India, LMW, J K Lakshmi Cements, HDFC, Canara Bank, Syndicate Bank,
Oct 26, 2016
ITC, HUL, Dabur India, Cadila Healthcare, Indoco Remedies
Maruti, TVS Motor, ABB, Vijaya Bank, Tech Mahindra, PVR, JSW Steel , ONGC, IOC, MRF, GSK Pharma, Glenmark
Oct 27, 2016
Pharma., Dishman Pharma, VRL Logistics
Oct 28, 2016
United Phosphorus, Bajaj Auto, Subros, IDFC, Nestle, Colgate, Marico, Sesa Goa, Heritage Foods, NTPC
Nov 1, 2016
Hindustan Media Ventures
Nov 2, 2016
HT Media
Nov 3, 2016
Ambuja Cements, Mphasis, MM Forging
Nov 4, 2016
Union Bank, Allahabad Bank, Competent Automobiles, Transport Corporation of India
Nov 5, 2016
Amara Raja Batteries, Mangalam Cement, Punjab Natl.Bank, Sterling Tools
Source: Bloomberg, Angel Research
Global economic events release calendar
Date
Time
Country
Event Description
Unit
Period
Bloomberg Data
Last Reported Estimated
Oct 26, 2016 7:30PM US
New home sales
Thousands
Sep
609.00
600.00
Oct 27, 2016 2:00PM UK
GDP (YoY)
% Change
3Q A
2.10
2.10
6:00PM US
Initial Jobless claims
Thousands
Oct 22
260.00
255.00
Oct 28, 2016 2:30PM Euro Zone
Euro-Zone Consumer Confidence
Value
Oct F
(8.00)
(8.00)
3:00PM UK
PMI Manufacturing
Value
Oct
55.40
--
Oct 31, 2016 6:00PM US
GDP Qoq (Annualised)
% Change
3Q A
1.40
2.50
Nov 1, 2016
3:30PM Euro Zone
Euro-Zone GDP s.a. (QoQ)
% Change
3Q A
0.30
--
6:30AM China
PMI Manufacturing
Value
Oct
50.40
50.40
Nov 2, 2016
2:25PM Germany
PMI Manufacturing
Value
Oct F
55.10
--
2:25PM Germany
Unemployment change (000's)
Thousands
Oct
1.00
--
11:30PM US
FOMC rate decision
%
Nov 2
0.50
0.50
Nov 3, 2016
5:30PM UK
BOE Announces rates
% Ratio
Nov 3
0.25
--
Nov 4, 2016
2:25PM Germany
PMI Services
Value
Oct F
54.10
--
6:00PM US
Change in Nonfarm payrolls
Thousands
Oct
156.00
169.00
6:00PM US
Unnemployment rate
%
Oct
5.00
4.90
Nov 8, 2016
China
Exports YoY%
% Change
Oct
(10.00)
--
7:00AM China
Consumer Price Index (YoY)
% Change
Oct
1.90
--
Nov 9, 2016
3:00PM UK
Industrial Production (YoY)
% Change
Sep
0.70
--
Nov 10, 2016
India
Imports YoY%
% Change
Oct
(2.50)
--
India
Exports YoY%
% Change
Oct
4.60
--
Nov 11, 2016 5:30PM India
Industrial Production YoY
% Change
Sep
(0.70)
--
Nov 14, 2016 7:30AM China
Industrial Production (YoY)
% Change
Oct
6.10
--
12:00PM India
Monthly Wholesale Prices YoY%
% Change
Oct
3.57
--
Nov 15, 2016 3:00PM UK
CPI (YoY)
% Change
Oct
1.00
--
12:30PM Germany
GDP nsa (YoY)
% Change
3Q P
3.10
--
Source: Bloomberg, Angel Research
Market Outlook
October 26, 2016
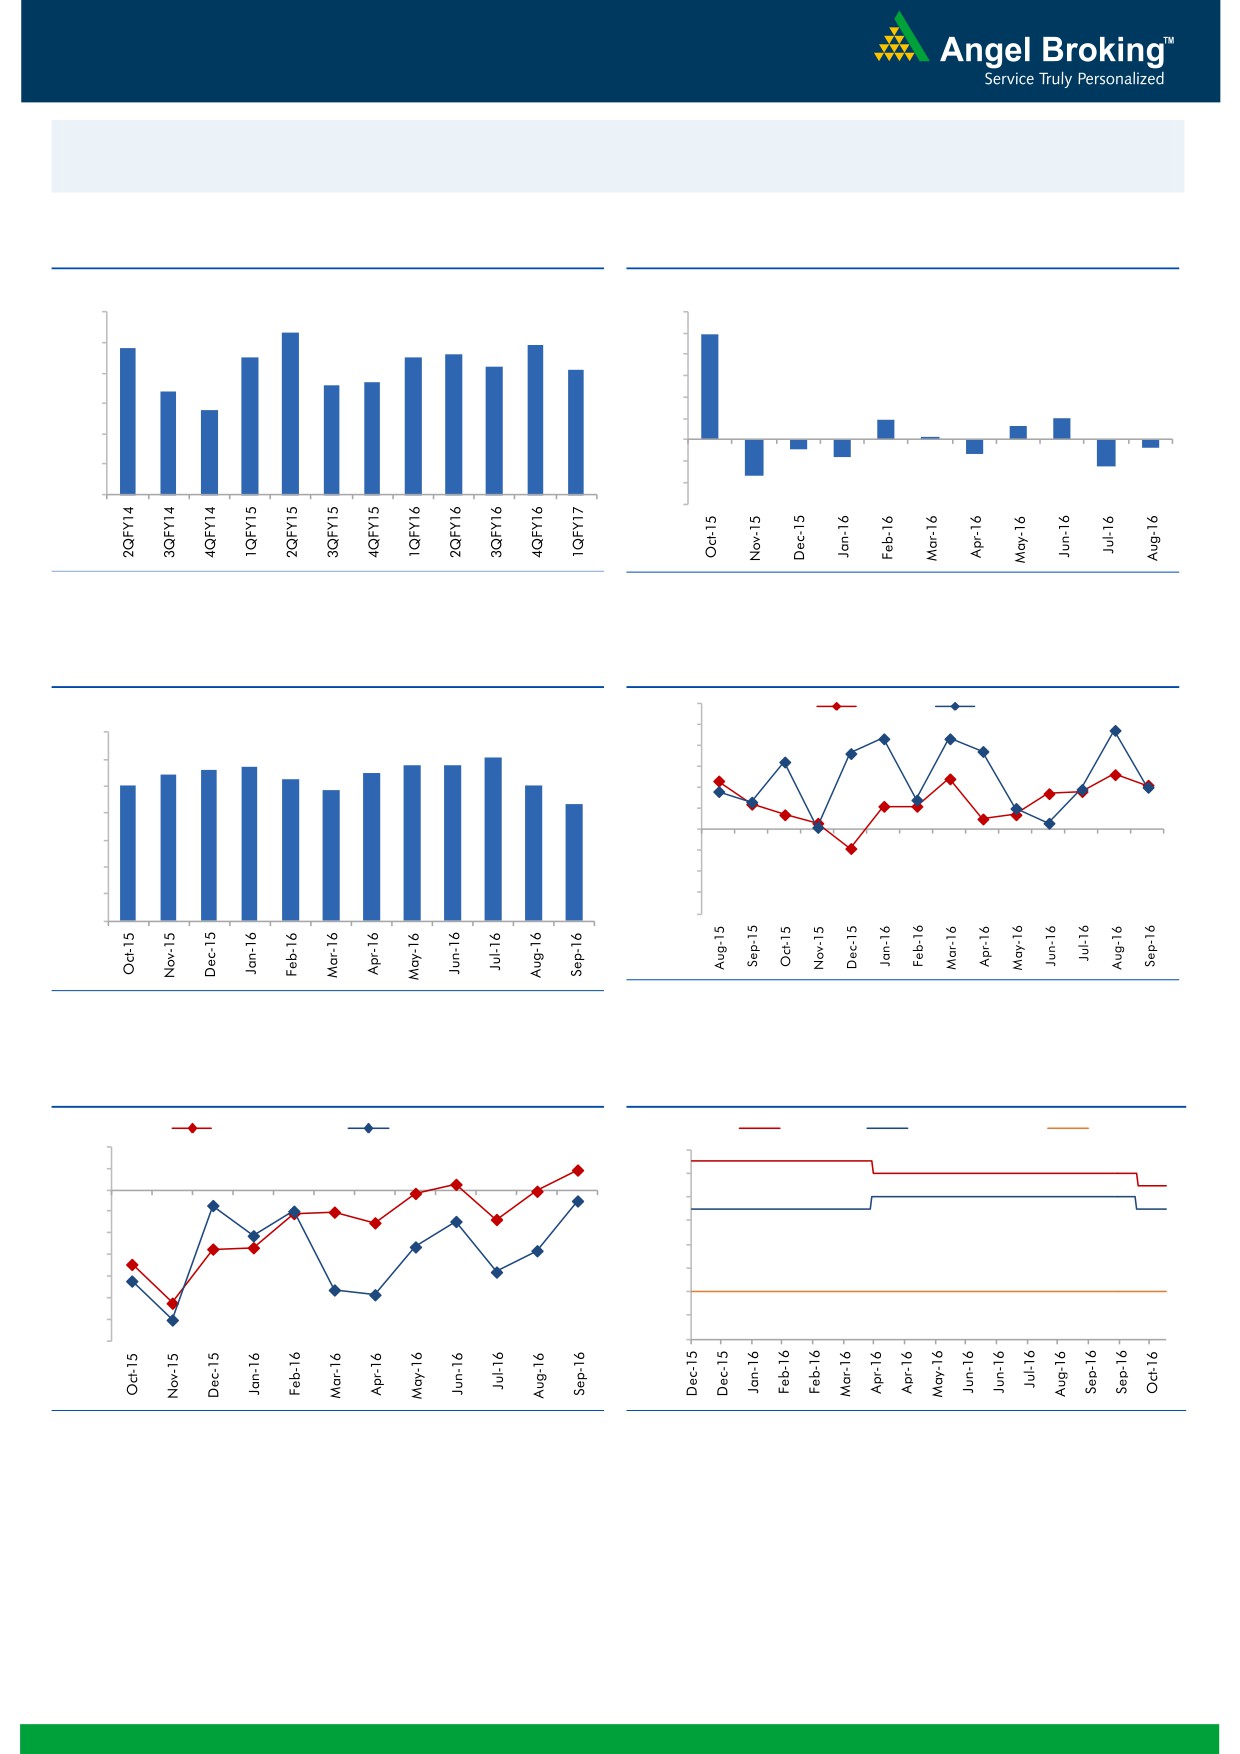
Macro watch
Exhibit 1: Quarterly GDP trends
Exhibit 2: IIP trends
(%)
(%)
9.0
12.0
8.3
9.9
7.8
7.9
10.0
8.0
7.5
7.5
7.6
7.2
7.1
8.0
6.6
6.7
7.0
6.4
6.0
5.8
6.0
4.0
1.9
2.0
1.3
2.0
0.3
5.0
-
4.0
(2.0)
(0.7)
(0.9)
(1.3)
(1.6)
(4.0)
(2.5)
3.0
(3.4)
(6.0)
Source: CSO, Angel Research
Source: MOSPI, Angel Research
Exhibit 3: Monthly CPI inflation trends
Exhibit 4: Manufacturing and services PMI
56.0
Mfg. PMI
Services PMI
(%)
55.0
7.0
6.1
54.0
5.6
5.7
5.8
5.8
6.0
5.4
5.5
5.0
5.3
5.1
53.0
4.8
5.0
4.3
52.0
4.0
51.0
50.0
3.0
49.0
2.0
48.0
1.0
47.0
46.0
-
Source: Market, Angel Research; Note: Level above 50 indicates expansion
Source: MOSPI, Angel Research
Exhibit 5: Exports and imports growth trends
Exhibit 6: Key policy rates
(%)
Exports yoy growth
Imports yoy growth
(%)
Repo rate
Reverse Repo rate
CRR
10.0
7.00
5.0
6.50
0.0
6.00
(5.0)
5.50
(10.0)
5.00
(15.0)
4.50
(20.0)
4.00
(25.0)
(30.0)
3.50
(35.0)
3.00
Source: Bloomberg, Angel Research
Source: RBI, Angel Research
Market Outlook
October 26, 2016
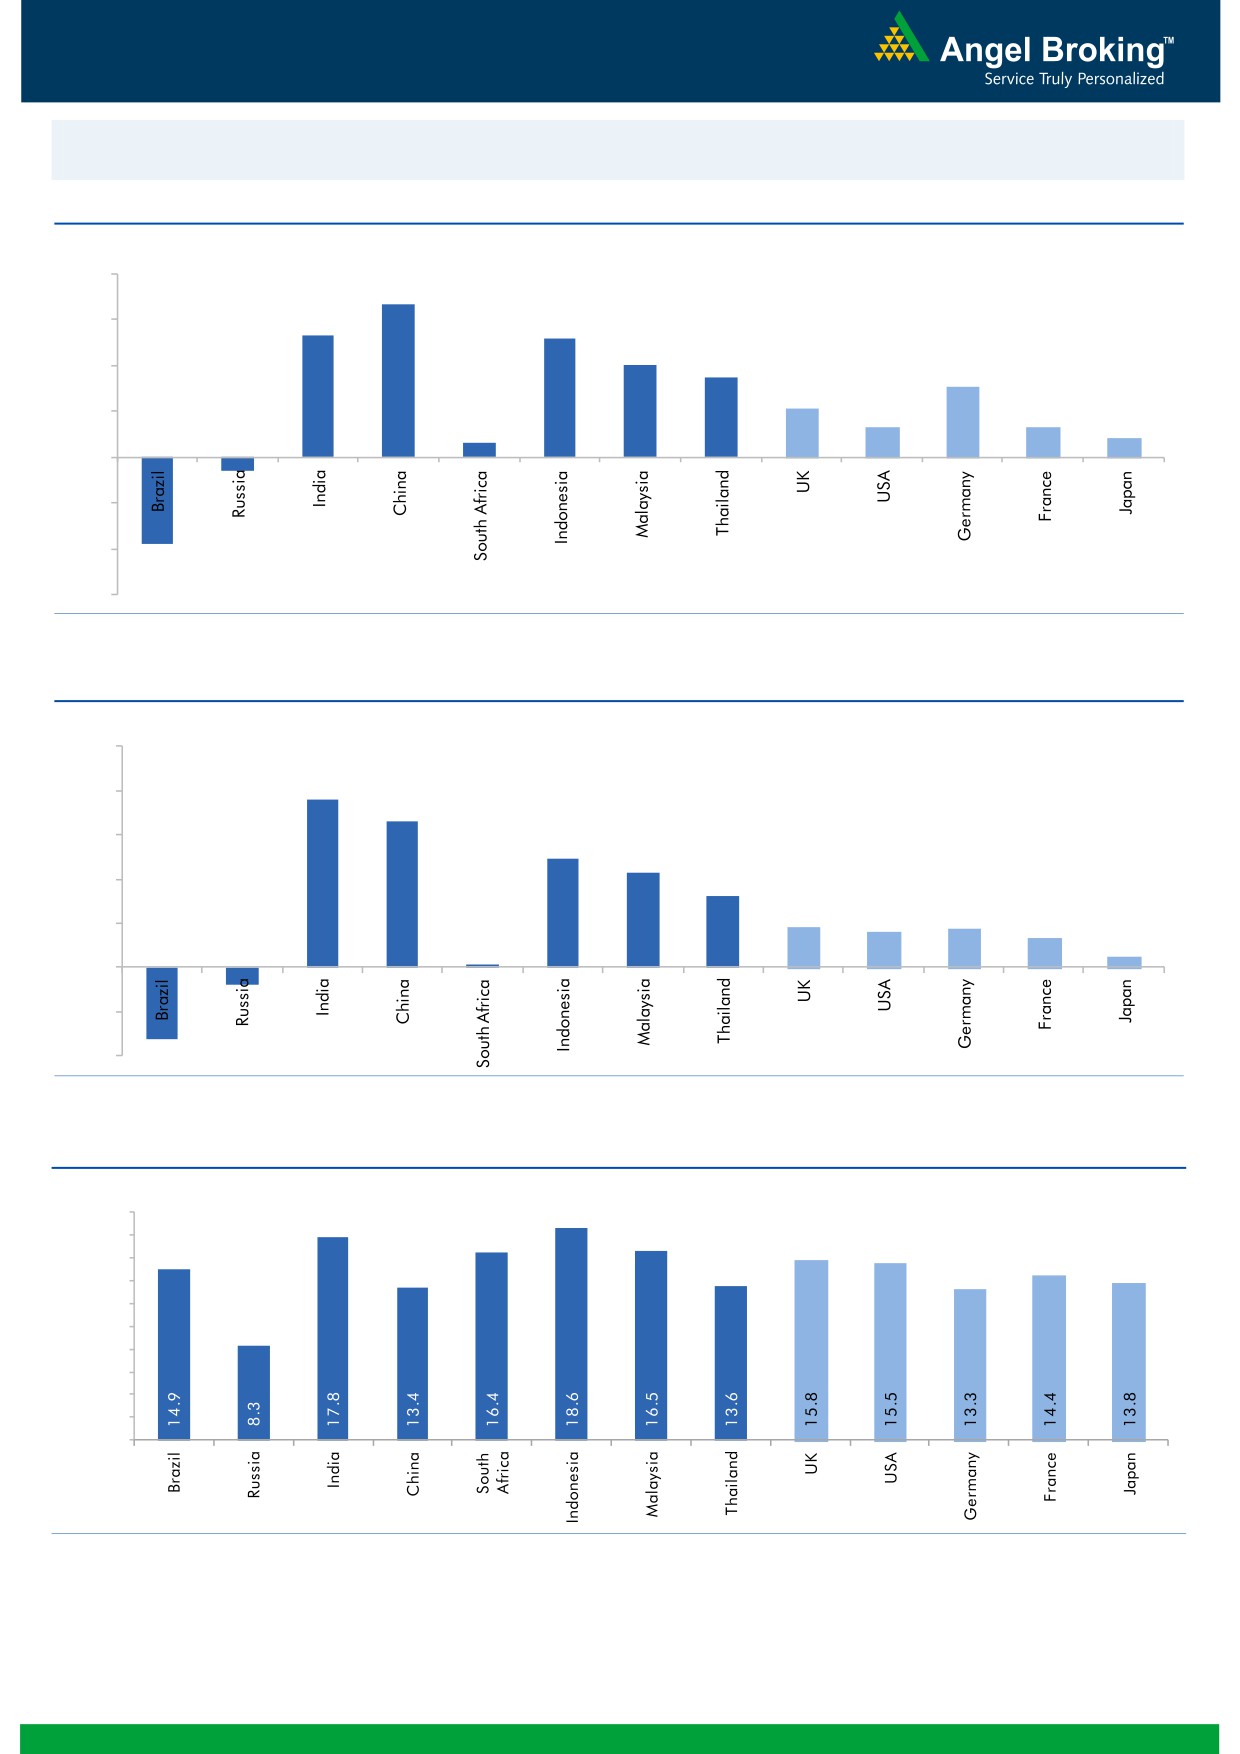
Global watch
Exhibit 1: Latest quarterly GDP Growth (%, yoy) across select developing and developed countries
(%)
8.0
6.7
6.0
5.3
0.6
5.2
4.0
3.5
4.0
3.1
2.1
2.0
1.3
1.3
0.8
-
(2.0)
(0.6)
(4.0)
(3.8)
(6.0)
Source: Bloomberg, Angel Research
Exhibit 2: 2016 GDP Growth projection by IMF (%, yoy) across select developing and developed countries
(%)
10.0
7.6
8.0
6.6
6.0
4.9
4.3
4.0
3.2
1.8
1.7
1.6
2.0
1.3
(0.8)
0.5
(3.3)
0.1
-
(2.0)
(4.0)
Source: IMF, Angel Research
Exhibit 3: One year forward P-E ratio across select developing and developed countries
(x)
20.0
18.0
16.0
14.0
12.0
10.0
8.0
6.0
4.0
2.0
-
Source: IMF, Angel Research
Market Outlook
October 26, 2016
Exhibit 4: Relative performance of indices across globe
Returns (%)
Country
Name of index
Closing price
1M
3M
1YR
Brazil
Bovespa
63,866
8.3
12.3
35.7
Russia
Micex
1,977
(1.7)
2.0
14.6
India
Nifty
8,691
(1.0)
1.5
6.3
China
Shanghai Composite
3,132
3.3
2.9
(7.8)
South Africa
Top 40
45,202
(0.5)
(2.9)
(7.4)
Mexico
Mexbol
48,094
0.7
2.5
7.6
Indonesia
LQ45
925
(0.9)
2.7
20.1
Malaysia
KLCI
1,677
0.5
1.2
(2.3)
Thailand
SET 50
949
(1.2)
(1.1)
3.6
USA
Dow Jones
18,169
(0.5)
(1.6)
3.3
UK
FTSE
7,018
1.6
4.4
9.0
Japan
Nikkei
17,365
3.3
3.3
(4.0)
Germany
DAX
10,757
0.8
5.0
(0.7)
France
CAC
4,541
1.2
2.1
(8.0)
Source: Bloomberg, Angel Research
Stock Watch
October 26, 2016
Company Name
Reco
CMP
Target
Mkt Cap
Sales ( Čcr )
OPM(%)
EPS (Č)
PER(x)
P/BV(x)
RoE(%)
EV/Sales(x)
(Č)
Price ( Č)
( Č cr )
FY17E FY18E
FY17E
FY18E
FY17E
FY18E
FY17E
FY18E
FY17E
FY18E
FY17E
FY18E
FY17E
FY18E
Agri / Agri Chemical
Rallis
Neutral
232
-
4,519
1,937
2,164
13.3
14.3
9.0
11.0
25.8
21.1
4.5
3.9
18.4
19.8
2.4
2.1
United Phosphorus
Neutral
712
-
36,075
15,176
17,604
18.5
18.5
37.4
44.6
19.0
16.0
3.7
3.1
21.4
21.2
2.5
2.1
Auto & Auto Ancillary
Ashok Leyland
Buy
88
111
24,930
22,407
26,022
10.6
10.6
5.2
6.4
16.8
13.6
3.8
3.2
23.6
24.7
1.2
1.0
Bajaj Auto
Neutral
2,800
-
81,021
25,093
27,891
19.5
19.2
143.9
162.5
19.5
17.2
5.5
4.7
30.3
29.4
3.0
2.6
Bharat Forge
Neutral
876
-
20,401
7,726
8,713
20.5
21.2
35.3
42.7
24.8
20.5
4.6
4.1
18.9
20.1
2.7
2.3
Eicher Motors
Neutral
24,631
-
66,901
16,583
20,447
17.5
18.0
598.0
745.2
41.2
33.1
14.1
10.7
41.2
38.3
3.9
3.1
Gabriel India
Neutral
125
-
1,793
1,544
1,715
9.0
9.3
5.4
6.3
23.1
19.8
4.4
3.9
18.9
19.5
1.1
1.0
Hero Motocorp
Neutral
3,357
-
67,040
31,253
35,198
15.3
15.0
172.3
192.1
19.5
17.5
7.1
6.1
38.9
37.0
2.0
1.8
Jamna Auto Industries Neutral
226
-
1,807
1,486
1,620
9.8
9.9
15.0
17.2
15.1
13.2
3.3
2.8
21.8
21.3
1.3
1.2
L G Balakrishnan & Bros Neutral
681
-
1,070
1,302
1,432
11.6
11.9
43.7
53.0
15.6
12.9
2.2
2.0
13.8
14.2
0.9
0.8
Mahindra and Mahindra Neutral
1,306
-
81,105
46,534
53,077
11.6
11.7
67.3
78.1
19.4
16.7
3.2
2.8
15.4
15.8
1.7
1.5
Maruti
Neutral
5,782
-
174,661
69,186
82,217
14.7
14.4
198.5
241.4
29.1
24.0
5.7
4.6
20.2
20.0
2.2
1.8
Minda Industries
Neutral
371
-
2,939
2,728
3,042
9.0
9.1
68.2
86.2
5.4
4.3
1.2
1.0
23.8
24.3
1.1
1.0
Motherson Sumi
Neutral
330
-
46,319
45,896
53,687
7.8
8.3
13.0
16.1
25.3
20.5
8.2
6.5
34.7
35.4
1.1
0.9
Rane Brake Lining
Neutral
1,269
-
1,005
511
562
11.3
11.5
28.1
30.9
45.2
41.1
6.9
6.3
15.3
15.0
2.1
1.9
Setco Automotive
Neutral
43
-
577
741
837
13.0
13.0
15.2
17.0
2.8
2.5
0.5
0.4
15.8
16.3
1.2
1.1
Tata Motors
Neutral
553
-
159,691
300,209
338,549
8.9
8.4
42.7
54.3
13.0
10.2
2.1
1.8
15.6
17.2
0.6
0.6
TVS Motor
Neutral
407
-
19,343
13,390
15,948
6.9
7.1
12.8
16.5
31.9
24.6
7.9
6.3
26.3
27.2
1.5
1.2
Amara Raja Batteries
Buy
1,033
1,218
17,644
5,429
6,471
17.5
17.6
35.3
43.5
29.3
23.8
6.7
5.4
25.3
24.8
3.1
2.5
Exide Industries
Neutral
203
-
17,293
7,439
8,307
15.0
15.0
8.1
9.3
25.1
21.9
3.5
3.1
14.3
16.7
1.9
1.7
Apollo Tyres
Accumulate
212
235
10,766
12,877
14,504
14.3
13.9
21.4
23.0
9.9
9.2
1.5
1.3
16.4
15.2
1.0
0.9
Ceat
Accumulate
1,263
1,450
5,108
7,524
8,624
13.0
12.7
131.1
144.3
9.6
8.8
1.8
1.5
19.8
18.6
0.8
0.7
JK Tyres
Neutral
147
-
3,342
7,455
8,056
15.0
15.0
21.8
24.5
6.8
6.0
1.4
1.2
22.8
21.3
0.6
0.5
Swaraj Engines
Neutral
1,349
-
1,675
660
810
15.2
16.4
54.5
72.8
24.8
18.5
7.7
7.0
31.5
39.2
2.4
1.9
Subros
Neutral
146
-
873
1,488
1,681
11.7
11.9
6.4
7.2
22.7
20.3
2.4
2.2
10.8
11.4
0.8
0.7
Indag Rubber
Neutral
198
-
519
286
326
19.8
16.8
11.7
13.3
16.9
14.8
2.9
2.7
17.8
17.1
1.5
1.3
Capital Goods
ACE
Neutral
46
-
457
709
814
4.1
4.6
1.4
2.1
33.0
22.0
1.4
1.3
4.4
6.0
0.8
0.7
BEML
Buy
935
1,157
3,895
3,451
4,055
6.3
9.2
31.4
57.9
29.8
16.2
1.8
1.6
6.3
10.9
1.2
1.0
Bharat Electronics
Accumulate
1,265
1,414
30,348
8,137
9,169
16.8
17.2
58.7
62.5
21.5
20.2
3.3
3.0
44.6
46.3
2.7
2.4
Stock Watch
October 26, 2016
Company Name
Reco
CMP
Target
Mkt Cap
Sales ( Čcr )
OPM(%)
EPS (Č)
PER(x)
P/BV(x)
RoE(%)
EV/Sales(x)
(Č)
Price ( Č)
( Č cr )
FY17E
FY18E
FY17E
FY18E
FY17E
FY18E
FY17E
FY18E
FY17E
FY18E
FY17E
FY18E
FY17E
FY18E
Capital Goods
Voltas
Neutral
398
-
13,161
6,511
7,514
7.9
8.7
12.9
16.3
30.8
24.4
5.6
4.9
16.7
18.5
1.8
1.5
BGR Energy
Neutral
116
-
839
16,567
33,848
6.0
5.6
7.8
5.9
14.9
19.7
0.9
0.8
4.7
4.2
0.2
0.1
BHEL
Neutral
140
-
34,352
28,797
34,742
-
2.8
2.3
6.9
61.0
20.3
1.0
1.0
1.3
4.8
0.8
0.6
Blue Star
Buy
543
634
5,180
4,283
5,077
5.9
7.3
14.9
22.1
36.5
24.6
7.1
6.0
20.4
26.4
1.3
1.1
Crompton Greaves
Neutral
76
-
4,776
5,777
6,120
5.9
7.0
3.3
4.5
23.1
16.9
1.0
1.0
4.4
5.9
0.8
0.7
Greaves Cotton
Neutral
139
-
3,387
1,755
1,881
16.8
16.9
7.8
8.5
17.8
16.3
3.6
3.3
20.6
20.9
1.6
1.5
Inox Wind
Buy
220
286
4,880
5,605
6,267
15.7
16.4
24.8
30.0
8.9
7.3
2.5
1.8
25.9
24.4
0.9
0.8
KEC International
Neutral
127
-
3,274
9,294
10,186
7.9
8.1
9.9
11.9
12.9
10.7
1.9
1.6
15.6
16.3
0.6
0.5
Thermax
Neutral
851
-
10,137
5,421
5,940
7.3
7.3
25.7
30.2
33.1
28.2
4.0
3.7
12.2
13.1
1.8
1.6
VATech Wabag
Buy
505
681
2,750
3,136
3,845
8.9
9.1
26.0
35.9
19.4
14.1
2.4
2.1
13.4
15.9
0.8
0.6
Cement
ACC
Neutral
1,552
-
29,152
11,225
13,172
13.2
16.9
44.5
75.5
34.9
20.6
3.3
3.0
11.2
14.2
2.6
2.2
Ambuja Cements
Neutral
248
-
49,234
9,350
10,979
18.2
22.5
5.8
9.5
42.8
26.1
3.6
3.2
10.2
12.5
5.3
4.5
India Cements
Neutral
159
-
4,870
4,364
4,997
18.5
19.2
7.9
11.3
20.1
14.0
1.4
1.4
8.0
8.5
1.9
1.6
JK Cement
Neutral
936
-
6,542
4,398
5,173
15.5
17.5
31.2
55.5
30.0
16.9
3.6
3.1
12.0
15.5
2.0
1.7
J K Lakshmi Cement
Accumulate
502
565
5,904
2,913
3,412
14.5
19.5
7.5
22.5
66.9
22.3
4.1
3.5
12.5
18.0
2.6
2.2
Orient Cement
Buy
175
215
3,589
2,114
2,558
18.5
20.5
8.1
11.3
21.6
15.5
3.2
2.7
9.0
14.0
2.3
1.8
UltraTech Cement
Neutral
4,017
-
110,247
25,768
30,385
21.0
23.5
111.0
160.0
36.2
25.1
4.6
4.0
13.5
15.8
4.4
3.6
Construction
ITNL
Neutral
116
-
3,801
8,946
10,017
31.0
31.6
8.1
9.1
14.3
12.7
0.5
0.5
4.2
5.0
3.8
3.5
KNR Constructions
Neutral
774
-
2,177
1,385
1,673
14.7
14.0
41.2
48.5
18.8
16.0
3.5
3.0
14.9
15.2
1.7
1.4
Larsen & Toubro
Accumulate
1,484
1,700
138,347
67,665
77,249
10.7
11.5
57.3
71.2
25.9
20.9
2.4
2.2
12.6
14.3
2.2
1.9
Gujarat Pipavav Port
Neutral
169
-
8,189
705
788
52.2
51.7
5.0
5.6
33.9
30.3
3.3
3.0
11.2
11.2
11.3
9.6
Nagarjuna Const.
Neutral
95
-
5,259
8,842
9,775
9.1
8.8
5.3
6.4
17.9
14.8
1.4
1.3
8.2
9.1
0.8
0.7
PNC Infratech
Buy
123
143
3,146
2,350
2,904
13.1
13.2
9.0
8.8
13.6
13.9
0.5
0.4
15.9
13.9
1.5
1.2
Simplex Infra
Neutral
331
-
1,637
6,829
7,954
10.5
10.5
31.4
37.4
10.5
8.9
1.1
1.0
9.9
13.4
0.7
0.6
Power Mech Projects
Neutral
512
-
753
1,801
2,219
12.7
14.6
72.1
113.9
7.1
4.5
1.3
1.1
16.8
11.9
0.4
0.3
Sadbhav Engineering
Accumulate
276
298
4,734
3,598
4,140
10.3
10.6
9.0
11.9
30.7
23.2
3.2
2.8
9.9
11.9
1.6
1.4
NBCC
Neutral
242
-
14,511
7,428
9,549
7.9
8.6
8.2
11.0
29.5
22.0
1.5
1.2
28.2
28.7
1.7
1.2
MEP Infra
Neutral
43
-
693
1,877
1,943
30.6
29.8
3.0
4.2
14.2
10.2
6.9
4.6
0.6
0.6
1.8
1.6
SIPL
Neutral
107
-
3,751
1,036
1,252
65.5
66.2
(8.4)
(5.6)
4.0
4.6
(22.8)
(15.9)
11.8
9.8
Stock Watch
October 26, 2016
Company Name
Reco
CMP
Target
Mkt Cap
Sales ( Čcr )
OPM(%)
EPS (Č)
PER(x)
P/BV(x)
RoE(%)
EV/Sales(x)
(Č)
Price ( Č)
( Č cr )
FY17E
FY18E
FY17E
FY18E
FY17E
FY18E
FY17E
FY18E
FY17E
FY18E
FY17E
FY18E
FY17E
FY18E
Construction
Engineers India
Neutral
273
-
9,197
1,725
1,935
16.0
19.1
11.4
13.9
23.9
19.6
3.3
3.2
13.4
15.3
4.3
3.8
Financials
Axis Bank
Buy
529
630
126,271
46,932
53,575
3.5
3.4
32.4
44.6
16.4
11.9
2.1
1.8
13.6
16.5
-
-
Bank of Baroda
Neutral
157
-
36,141
19,980
23,178
1.8
1.8
11.5
17.3
13.6
9.1
1.6
1.3
8.3
10.1
-
-
Canara Bank
Neutral
324
-
17,566
15,225
16,836
1.8
1.8
14.5
28.0
22.3
11.6
1.5
1.2
5.8
8.5
-
-
Dewan Housing Finance Accumulate
326
350
9,508
2,225
2,688
2.9
2.9
29.7
34.6
11.0
9.4
1.8
1.5
16.1
16.8
-
-
Equitas Holdings
Buy
178
235
5,966
939
1,281
11.7
11.5
5.8
8.2
30.7
21.7
2.6
2.4
10.9
11.5
-
-
Federal Bank
Neutral
81
-
13,943
9,353
10,623
2.9
2.9
4.4
5.8
18.4
14.0
1.8
1.6
9.5
11.0
-
-
HDFC
Neutral
1,340
-
211,818
11,475
13,450
3.4
3.4
45.3
52.5
29.6
25.5
5.7
5.0
20.2
20.5
-
-
HDFC Bank
Accumulate
1,250
1,350
316,569
46,097
55,433
4.5
4.5
58.4
68.0
21.4
18.4
3.8
3.1
18.8
18.6
-
-
ICICI Bank
Neutral
289
-
168,167
39,029
45,903
3.3
3.3
16.7
16.3
17.3
17.7
2.1
2.0
10.1
12.4
-
-
LIC Housing Finance
Accumulate
598
630
30,154
3,712
4,293
2.6
2.5
39.0
46.0
15.3
13.0
2.9
2.5
19.9
20.1
-
-
Punjab Natl.Bank
Neutral
146
-
31,143
23,532
23,595
2.3
2.4
6.8
12.6
21.5
11.6
3.3
2.4
3.3
6.5
-
-
RBL Bank
Accumulate
345
365
12,740
1,783
2,309
2.6
2.6
12.7
16.4
27.1
21.0
3.0
2.6
12.8
13.3
-
-
South Ind.Bank
Neutral
24
-
3,268
6,435
7,578
2.5
2.5
2.7
3.1
9.0
7.8
1.2
1.0
10.1
11.2
-
-
St Bk of India
Neutral
261
-
202,841
88,650
98,335
2.6
2.6
13.5
18.8
19.4
13.9
1.8
1.6
7.0
8.5
-
-
Union Bank
Neutral
148
-
10,160
13,450
14,925
2.3
2.3
25.5
34.5
5.8
4.3
0.8
0.7
7.5
10.2
-
-
Yes Bank
Neutral
1,308
-
55,060
8,978
11,281
3.3
3.4
74.0
90.0
17.7
14.5
3.4
2.8
17.0
17.2
-
-
FMCG
Asian Paints
Neutral
1,140
-
109,349
17,128
18,978
16.8
16.4
19.1
20.7
59.7
55.1
20.8
19.6
34.8
35.5
6.3
5.7
Britannia
Accumulate
3,293
3,626
39,509
9,795
11,040
14.6
14.9
80.3
94.0
41.0
35.0
16.9
13.0
41.2
-
3.9
3.4
Colgate
Accumulate
944
995
25,677
4,605
5,149
23.4
23.4
23.8
26.9
39.7
35.1
22.0
17.2
64.8
66.8
5.5
4.9
Dabur India
Accumulate
284
304
50,039
8,315
9,405
19.8
20.7
8.1
9.2
35.1
30.9
9.8
8.1
31.6
31.0
5.7
5.0
GlaxoSmith Con*
Neutral
6,104
-
25,670
4,350
4,823
21.2
21.4
179.2
196.5
34.1
31.1
9.1
7.7
27.1
26.8
5.3
4.7
Godrej Consumer
Neutral
1,622
-
55,236
10,235
11,428
18.4
18.6
41.1
44.2
39.5
36.7
8.8
7.4
24.9
24.8
5.5
4.8
HUL
Neutral
832
-
180,076
35,252
38,495
17.6
17.4
20.4
21.9
40.7
38.0
33.5
29.4
82.2
77.3
4.9
4.5
ITC
Buy
239
283
288,191
40,059
44,439
39.0
39.2
9.1
10.1
26.3
23.7
7.1
6.3
27.2
26.5
6.7
6.0
Marico
Accumulate
285
300
36,731
6,430
7,349
18.8
19.5
6.4
7.7
44.5
37.0
13.4
11.3
33.2
32.5
5.5
4.8
Nestle*
Neutral
6,783
-
65,396
10,073
11,807
20.7
21.5
124.8
154.2
54.4
44.0
22.3
20.1
34.8
36.7
6.3
5.4
Tata Global
Neutral
150
-
9,467
8,675
9,088
9.8
9.8
7.4
8.2
20.3
18.3
2.3
2.2
7.9
8.1
1.0
0.9
Procter & Gamble
Neutral
7,050
-
22,885
2,939
3,342
23.2
23.0
146.2
163.7
48.2
43.1
108.0
103.5
25.3
23.5
7.3
6.4
Hygiene
Stock Watch
October 26, 2016
Company Name
Reco
CMP
Target
Mkt Cap
Sales ( Čcr )
OPM(%)
EPS (Č)
PER(x)
P/BV(x)
RoE(%)
EV/Sales(x)
(Č)
Price ( Č)
( Č cr )
FY17E FY18E
FY17E
FY18E
FY17E
FY18E
FY17E
FY18E
FY17E
FY18E
FY17E
FY18E
FY17E
FY18E
IT
HCL Tech^
Buy
804
1,000
113,446
49,242
57,168
20.5
20.5
55.7
64.1
14.4
12.6
2.9
2.3
20.3
17.9
2.2
1.8
Infosys
Buy
1,017
1,249
233,680
68,350
77,326
27.0
27.0
62.5
69.4
16.3
14.7
3.5
3.2
21.3
21.6
2.9
2.5
TCS
Accumulate
2,399
2,620
472,637
119,025
133,308
27.6
27.6
131.2
145.5
18.3
16.5
5.9
5.5
32.4
33.1
3.7
3.3
Tech Mahindra
Buy
433
700
42,055
30,347
33,685
17.0
17.0
37.5
41.3
11.6
10.5
2.5
2.2
21.8
20.7
1.1
0.9
Wipro
Buy
481
590
116,979
55,440
60,430
18.1
18.1
35.9
39.9
13.4
12.1
2.4
2.2
19.0
19.3
1.8
1.7
Media
D B Corp
Neutral
385
-
7,078
2,297
2,590
27.4
28.2
21.0
23.4
18.3
16.5
4.3
3.7
23.7
23.1
2.9
2.5
HT Media
Neutral
91
-
2,117
2,693
2,991
12.6
12.9
7.9
9.0
11.5
10.1
1.0
0.9
7.8
8.3
0.4
0.2
Jagran Prakashan
Accumulate
199
225
6,510
2,355
2,635
28.0
28.0
10.8
12.5
18.4
15.9
4.0
3.5
21.7
21.7
2.8
2.4
Sun TV Network
Neutral
533
-
21,015
2,850
3,265
70.1
71.0
26.2
30.4
20.4
17.5
5.2
4.6
24.3
25.6
7.0
5.9
Hindustan Media
Neutral
302
-
2,213
1,016
1,138
24.3
25.2
27.3
30.1
11.0
10.0
2.1
1.9
16.2
15.8
1.5
1.3
Ventures
TV Today Network
Accumulate
335
363
1,998
637
743
27.5
27.5
18.4
21.4
18.2
15.7
3.2
2.7
17.4
17.2
2.7
2.3
Metals & Mining
Coal India
Neutral
320
-
201,966
84,638
94,297
21.4
22.3
24.5
27.1
13.1
11.8
5.4
5.2
42.6
46.0
1.9
1.7
Hind. Zinc
Neutral
254
-
107,492
14,252
18,465
55.9
48.3
15.8
21.5
16.1
11.8
2.6
2.3
17.0
20.7
7.5
5.8
Hindalco
Neutral
150
-
31,068
107,899
112,095
7.4
8.2
9.2
13.0
16.4
11.6
0.8
0.7
4.8
6.6
0.8
0.8
JSW Steel
Neutral
1,708
-
41,284
53,201
58,779
16.1
16.2
130.6
153.7
13.1
11.1
1.8
1.5
14.0
14.4
1.5
1.3
NMDC
Neutral
123
-
48,766
6,643
7,284
44.4
47.7
7.1
7.7
17.3
16.0
1.5
1.5
8.8
9.2
5.1
4.6
SAIL
Neutral
51
-
20,898
47,528
53,738
(0.7)
2.1
(1.9)
2.6
19.5
0.6
0.5
(1.6)
3.9
1.3
1.2
Vedanta
Neutral
204
-
60,465
71,744
81,944
19.2
21.7
13.4
20.1
15.2
10.2
1.3
1.2
8.4
11.3
1.2
0.9
Tata Steel
Neutral
416
-
40,354
121,374
121,856
7.2
8.4
18.6
34.3
22.3
12.1
1.4
1.3
6.1
10.1
1.0
1.0
Oil & Gas
Cairn India
Neutral
230
-
43,206
9,127
10,632
4.3
20.6
8.8
11.7
26.2
19.7
0.8
0.8
3.3
4.2
6.2
5.1
GAIL
Neutral
435
-
55,166
56,220
65,198
9.3
10.1
27.1
33.3
16.1
13.1
1.5
1.4
9.3
10.7
1.2
1.0
ONGC
Neutral
289
-
247,339
137,222
152,563
15.0
21.8
19.5
24.1
14.8
12.0
1.3
1.2
8.5
10.1
2.1
1.9
Indian Oil Corp
Neutral
327
-
158,740
373,359
428,656
5.9
5.5
54.0
59.3
6.1
5.5
0.9
0.8
16.0
15.6
0.6
0.5
Reliance Industries
Neutral
1,060
-
343,667
301,963
358,039
12.1
12.6
87.7
101.7
12.1
10.4
1.2
1.1
10.7
11.3
1.6
1.3
Pharmaceuticals
Alembic Pharma
Neutral
673
-
12,692
3,483
4,083
20.2
21.4
24.3
30.4
27.7
22.2
6.3
5.0
25.5
25.3
3.6
3.0
Aurobindo Pharma
Accumulate
824
877
48,233
15,720
18,078
23.7
23.7
41.4
47.3
19.9
17.4
5.2
4.1
29.6
26.1
3.3
2.9
Sanofi India*
Neutral
4,315
-
9,937
2,357
2,692
17.3
17.3
153.5
169.2
28.1
25.5
4.8
3.9
25.8
28.4
3.9
3.2
Cadila Healthcare
Neutral
408
-
41,738
11,126
13,148
22.0
22.0
17.1
20.0
23.8
20.4
6.1
4.9
28.8
26.6
3.8
3.1
Cipla
Sell
585
490
47,033
15,378
18,089
17.4
18.4
21.6
27.2
27.1
21.5
3.5
3.1
13.7
15.2
3.3
2.7
Stock Watch
October 26, 2016
Company Name
Reco
CMP
Target
Mkt Cap
Sales ( Čcr )
OPM(%)
EPS (Č)
PER(x)
P/BV(x)
RoE(%)
EV/Sales(x)
(Č)
Price ( Č)
( Č cr )
FY17E FY18E
FY17E
FY18E
FY17E
FY18E
FY17E
FY18E
FY17E
FY18E
FY17E
FY18E
FY17E
FY18E
Pharmaceuticals
Dr Reddy's
Neutral
3,200
-
53,031
16,043
18,119
23.1
24.7
126.0
157.8
25.4
20.3
3.7
3.2
15.7
17.1
3.3
2.9
Dishman Pharma
Sell
232
45
3,748
1,718
1,890
22.7
22.8
9.5
11.3
24.5
20.6
2.4
2.1
10.1
10.9
2.6
2.3
GSK Pharma*
Neutral
2,936
-
24,865
3,528
3,811
16.6
18.8
51.8
59.4
56.7
49.4
15.2
15.1
26.3
30.6
6.8
6.4
Indoco Remedies
Sell
299
225
2,755
1,112
1,289
18.2
18.2
13.2
15.6
22.7
19.2
4.0
3.4
19.2
19.2
2.6
2.2
Ipca labs
Neutral
631
-
7,961
3,303
3,799
15.3
15.3
17.3
19.7
36.5
32.0
3.2
2.9
9.1
9.4
2.5
2.2
Lupin
Buy
1,525
1,809
68,739
15,912
18,644
26.4
26.7
58.1
69.3
26.2
22.0
5.1
4.2
21.4
20.9
4.4
3.6
Sun Pharma
Buy
748
944
179,961
31,129
35,258
30.0
30.9
28.0
32.8
26.7
22.8
4.1
3.4
18.7
18.9
5.4
4.5
Power
Tata Power
Neutral
82
-
22,286
36,916
39,557
17.4
27.1
5.1
6.3
16.2
13.1
1.4
1.3
9.0
10.3
1.6
1.5
NTPC
Neutral
152
-
125,455
86,605
95,545
17.5
20.8
11.8
13.4
12.9
11.4
1.3
1.2
10.5
11.1
2.8
2.8
Power Grid
Neutral
178
-
93,148
25,763
29,762
74.3
73.1
14.8
17.3
12.0
10.3
1.9
1.7
16.9
17.5
7.9
7.5
Real Estate
MLIFE
Buy
436
522
1,789
1,152
1,300
22.7
24.6
29.9
35.8
14.6
12.2
1.1
1.0
7.6
8.6
2.3
1.9
Telecom
Bharti Airtel
Neutral
311
-
124,339
105,086
114,808
34.5
34.7
12.2
16.4
25.5
19.0
1.7
1.6
6.8
8.4
2.1
1.8
Idea Cellular
Neutral
75
-
27,150
40,133
43,731
37.2
37.1
6.4
6.5
11.8
11.6
1.0
0.9
8.2
7.6
1.7
1.4
zOthers
Abbott India
Neutral
4,720
-
10,030
3,153
3,583
14.1
14.4
152.2
182.7
31.0
25.8
152.3
130.0
25.6
26.1
2.9
2.5
Bajaj Electricals
Buy
261
306
2,636
5,099
5,805
5.6
5.9
11.4
14.6
22.9
17.9
3.1
2.7
13.4
15.1
0.5
0.5
Finolex Cables
Neutral
438
-
6,705
2,883
3,115
12.0
12.1
14.2
18.6
30.9
23.6
16.4
14.4
15.8
14.6
2.0
1.8
Goodyear India*
Neutral
778
-
1,795
1,598
1,704
10.4
10.2
49.4
52.6
15.8
14.8
72.7
63.8
18.2
17.0
0.8
113.6
Hitachi
Neutral
1,526
-
4,150
2,081
2,433
8.8
8.9
33.4
39.9
45.7
38.3
36.9
30.7
22.1
21.4
2.0
1.7
Jyothy Laboratories
Neutral
357
-
6,487
1,440
2,052
11.5
13.0
8.5
10.0
42.0
35.7
10.2
9.4
18.6
19.3
4.8
3.3
Page Industries
Neutral
16,694
-
18,621
2,450
3,124
20.1
17.6
299.0
310.0
55.8
53.9
371.8
283.8
47.1
87.5
7.7
6.0
Relaxo Footwears
Neutral
432
-
5,180
2,085
2,469
9.2
8.2
7.6
8.0
57.1
54.3
22.1
18.9
17.9
18.8
2.6
2.2
Siyaram Silk Mills
Accumulate
1,537
1,714
1,441
1,799
2,040
11.6
11.7
104.9
122.4
14.7
12.6
2.4
2.1
16.4
16.4
1.0
0.9
Styrolution ABS India*
Neutral
649
-
1,141
1,440
1,537
9.2
9.0
40.6
42.6
16.0
15.2
40.8
37.1
12.3
11.6
0.8
0.7
TVS Srichakra
Neutral
3,842
-
2,942
2,304
2,614
13.7
13.8
231.1
266.6
16.6
14.4
431.7
339.9
33.9
29.3
1.3
1.1
HSIL
Neutral
347
-
2,505
2,384
2,515
15.8
16.3
15.3
19.4
22.7
17.9
22.5
19.4
7.8
9.3
1.2
1.1
Kirloskar Engines India
Neutral
350
-
5,061
2,554
2,800
9.9
10.0
10.5
12.1
33.3
28.9
13.9
13.2
10.7
11.7
1.6
1.4
Ltd
M M Forgings
Neutral
451
-
544
546
608
20.4
20.7
41.3
48.7
10.9
9.3
61.8
54.7
16.6
17.0
0.8
0.8
Banco Products (India)
Neutral
228
-
1,627
1,353
1,471
12.3
12.4
14.5
16.3
15.7
14.0
21.7
19.5
14.5
14.6
1.1
122.9
Competent Automobiles Neutral
211
-
130
1,137
1,256
3.1
2.7
28.0
23.6
7.6
9.0
40.7
36.7
14.3
11.5
0.1
0.1
Stock Watch
October 26, 2016
Company Name
Reco
CMP
Target
Mkt Cap
Sales ( Čcr )
OPM(%)
EPS (Č)
PER(x)
P/BV(x)
RoE(%)
EV/Sales(x)
(Č)
Price ( Č)
( Č cr )
FY17E
FY18E
FY17E
FY18E
FY17E
FY18E
FY17E
FY18E
FY17E
FY18E
FY17E
FY18E
FY17E
FY18E
zOthers
Nilkamal
Neutral
1,758
-
2,623
1,995
2,165
10.7
10.4
69.8
80.6
25.2
21.8
100.5
87.3
16.6
16.5
1.3
1.2
Visaka Industries
Neutral
221
-
351
1,051
1,138
10.3
10.4
21.0
23.1
10.5
9.5
28.3
26.5
9.0
9.2
0.6
0.6
Transport Corporation of
Neutral
183
-
1,399
2,671
2,911
8.5
8.8
13.9
15.7
13.2
11.7
1.8
1.6
13.7
13.8
0.6
0.6
India
Elecon Engineering
Neutral
68
-
742
1,482
1,660
13.7
14.5
3.9
5.8
17.5
11.7
4.1
3.8
7.8
10.9
0.8
0.7
Surya Roshni
Neutral
234
-
1,024
3,342
3,625
7.8
7.5
17.3
19.8
13.5
11.8
25.7
20.6
10.5
10.8
0.6
0.5
MT Educare
Neutral
136
-
543
366
417
17.7
18.2
9.4
10.8
14.6
12.6
3.2
2.8
22.2
22.3
1.4
1.2
Radico Khaitan
Neutral
138
-
1,836
1,659
1,802
13.0
13.2
6.3
7.4
21.8
18.7
1.9
1.7
8.6
9.3
1.5
1.4
Garware Wall Ropes
Neutral
554
-
1,212
873
938
12.9
13.1
30.9
34.9
17.9
15.9
2.8
2.4
15.7
15.2
1.3
1.2
Wonderla Holidays
Neutral
405
-
2,289
287
355
38.0
40.0
11.3
14.2
35.9
28.5
5.1
4.5
21.4
23.9
7.7
6.2
Linc Pen & Plastics
Neutral
260
-
384
382
420
9.3
9.5
13.5
15.7
19.3
16.5
3.3
2.9
17.1
17.3
1.1
1.0
The Byke Hospitality
Neutral
182
-
731
287
384
20.5
20.5
7.6
10.7
24.0
17.0
5.0
4.1
20.7
23.5
2.6
1.9
Interglobe Aviation
Neutral
926
-
33,351
21,122
26,005
14.5
27.6
110.7
132.1
8.4
7.0
50.0
35.7
168.5
201.1
1.6
1.2
Coffee Day Enterprises
Neutral
224
-
4,621
2,964
3,260
20.5
21.2
4.7
8.0
-
28.0
2.6
2.4
5.5
8.5
2.0
1.7
Ltd
Navneet Education
Neutral
109
-
2,599
1,062
1,147
24.0
24.0
6.1
6.6
17.9
16.5
3.7
3.3
20.6
19.8
2.5
2.3
Navkar Corporation
Buy
200
265
2,852
408
612
42.9
42.3
6.8
11.5
29.5
17.4
2.0
1.8
6.9
10.5
7.9
5.3
UFO Moviez
Neutral
446
-
1,230
619
685
33.2
33.4
30.0
34.9
14.9
12.8
2.1
1.8
13.8
13.9
1.7
1.4
VRL Logistics
Neutral
318
-
2,902
1,902
2,119
16.7
16.6
14.6
16.8
21.8
18.9
4.8
4.2
21.9
22.2
1.6
1.4
Team Lease Serv.
Neutral
1,000
-
1,710
3,229
4,001
1.5
1.8
22.8
32.8
43.9
30.5
4.7
4.1
10.7
13.4
0.4
0.3
S H Kelkar & Co.
Neutral
311
-
4,500
1,036
1,160
15.1
15.0
6.1
7.2
51.0
43.4
5.4
5.0
10.7
11.5
4.2
3.7
Quick Heal
Neutral
253
-
1,775
408
495
27.3
27.0
7.7
8.8
32.7
28.8
3.0
3.0
9.3
10.6
3.5
2.9
Narayana Hrudaya
Neutral
360
-
7,357
1,873
2,166
11.5
11.7
2.6
4.0
136.1
90.8
8.4
7.5
6.1
8.3
4.0
3.5
Manpasand Bever.
Neutral
726
-
4,152
836
1,087
19.6
19.4
16.9
23.8
43.0
30.5
5.2
4.5
12.0
14.8
4.7
3.5
Parag Milk Foods
Neutral
314
-
2,640
1,919
2,231
9.3
9.6
9.5
12.9
33.2
24.3
5.2
4.3
15.5
17.5
1.5
1.3
Mirza International
Buy
94
113
1,135
1,024
1,148
18.0
18.0
6.9
8.0
13.7
11.8
2.3
2.0
16.6
16.2
1.3
1.1
Asian Granito
Buy
276
351
830
1,118
1,220
11.8
12.0
13.0
16.0
21.2
17.3
2.1
1.8
9.7
10.7
1.0
0.9
Source: Company, Angel Research; Note: *December year end; #September year end; &October year end; Price as on October 25, 2016
Market Outlook
October 26, 2016
Research Team Tel: 022 - 39357800
DISCLAIMER
Angel Broking Private Limited (hereinafter referred to as “Angel”) is a registered Member of National Stock Exchange of India
Limited,Bombay Stock Exchange Limited and Metropolitan Stock Exchange Limited. It is also registered as a Depository Participant with
CDSL and Portfolio Manager with SEBI. It also has registration with AMFI as a Mutual Fund Distributor. Angel Broking Private Limited is a
registered entity with SEBI for Research Analyst in terms of SEBI (Research Analyst) Regulations, 2014 vide registration number
INH000000164. Angel or its associates has not been debarred/ suspended by SEBI or any other regulatory authority for accessing
/dealing in securities Market. Angel or its associates/analyst has not received any compensation / managed or
co-managed public offering of securities of the company covered by Analyst during the past twelve months.
This document is solely for the personal information of the recipient, and must not be singularly used as the basis of any investment
decision. Nothing in this document should be construed as investment or financial advice. Each recipient of this document should make
such investigations as they deem necessary to arrive at an independent evaluation of an investment in the securities of the companies
referred to in this document (including the merits and risks involved), and should consult their own advisors to determine the merits and
risks of such an investment.
Reports based on technical and derivative analysis center on studying charts of a stock's price movement, outstanding positions and
trading volume, as opposed to focusing on a company's fundamentals and, as such, may not match with a report on a company's
fundamentals. Investors are advised to refer the Fundamental and Technical Research Reports available on our website to evaluate the
contrary view, if any.
The information in this document has been printed on the basis of publicly available information, internal data and other reliable
sources believed to be true, but we do not represent that it is accurate or complete and it should not be relied on as such, as this
document is for general guidance only. Angel Broking Pvt. Limited or any of its affiliates/ group companies shall not be in any way
responsible for any loss or damage that may arise to any person from any inadvertent error in the information contained in this report.
Angel Broking Pvt. Limited has not independently verified all the information contained within this document. Accordingly, we cannot
testify, nor make any representation or warranty, express or implied, to the accuracy, contents or data contained within this document.
While Angel Broking Pvt. Limited endeavors to update on a reasonable basis the information discussed in this material, there may be
regulatory, compliance, or other reasons that prevent us from doing so.
This document is being supplied to you solely for your information, and its contents, information or data may not be reproduced,
redistributed or passed on, directly or indirectly.
Neither Angel Broking Pvt. Limited, nor its directors, employees or affiliates shall be liable for any loss or damage that may arise from
or in connection with the use of this information.